Aug
2021
01

There is ONE clear way to grow your revenue and value…
Demystifying churn
Reducing churn is the most effective way to generate revenue growth and increased profitability. It’s a much better path than selling more to existing customers or finding new customers. That’s because the marketing and sales cost of customer acquisition has already been absorbed. It’s a sunk cost.
Churn is most of the time an expression of customer dissatisfaction, although as we will see below, that is not always true. It is one of the components of the fourth alignment in our A4 Precision Alignment™ methodology: Delight ⟷ Offering.
There are several misunderstandings about churn, and it is a more subtle concept than many can imagine. So, let’s dive into it…
So, what is churn, really?
There are, in fact, five different types of churn and it is important to make distinctions among them, as different measures can be taken to address each type.
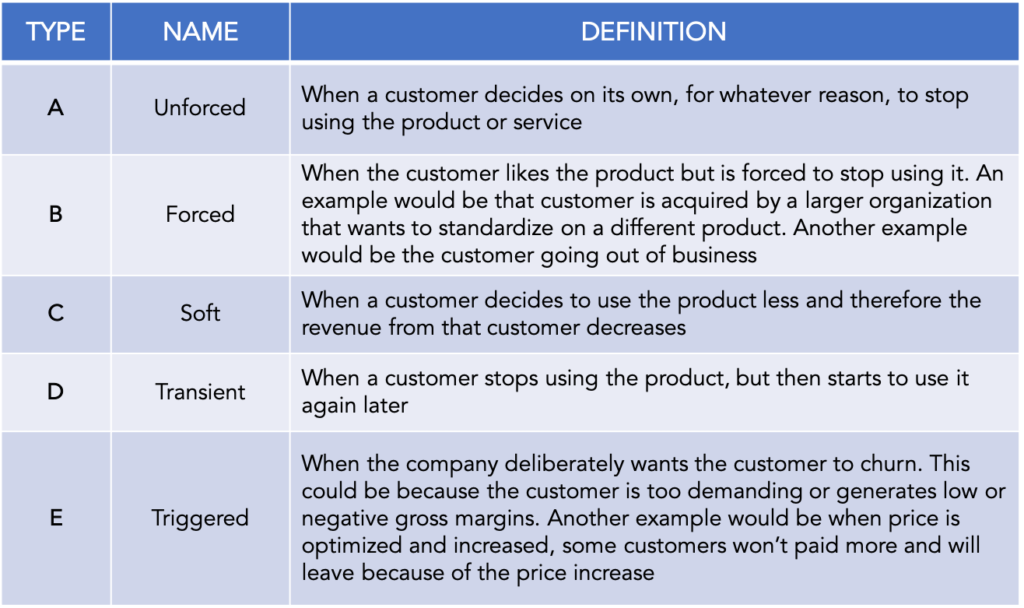
Note that Types A and B are like in tennis, hence the name we use, when one player attacks a ball and causes the other player to make an error and lose the point, it’s called a “forced” error. Now, if the player makes a mistake and loses the point, it’s called an “unforced” error. The player is responsible for his mistake. In the case of Unforced churn, the company is responsible for the churn. In the case of Forced churn, there is nothing the company can do or could have done differently to avoid the loss.
Both Type A and Type B churn are defined as “hard” churn because the customers has stopped using the product. Type E is also a hard churn.
You may have heard about “negative” churn, which applies when a customer spends more and more money. I am not enthusiastic about that term. To me, all businesses should always attempt to sell more and more to an existing customer, this is really part of expanding after landing the account.
The real pain of churn
Churn has a dramatic effect on top-line growth. It limits shareholder value creation, as we will demonstrate in the example below. Therefore, it is critical for every business to really understand not only the type of churn, but the effect on missed revenue and how much equity value has been lost.
Like customers, churn can be examined through two different metrics: the number of accounts lost, and the dollar amount not realized in revenue because of churn.
Let’s take an example of one of our clients we worked with in 2020. The company has a SaaS software offering with recurring monthly revenue. We wanted to measure how much revenue our client would have enjoyed in the idealistic world of zero churn. Note that we did not look at Transient churn (Type D), as it was a very small percentage of revenue, nor did we look at Triggered churn (Type E), since there was none in this case.
We studied four different customer profiles:
1. The ideal customer
Loves the product and spends more and more money as usage increases quarter over quarter. That ideal customer does not churn. Don’t we all wish to only have these customers? Of course, we do!
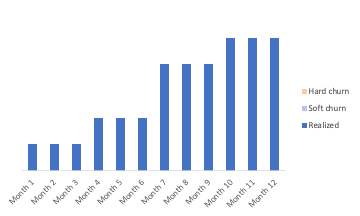
2. The lost customer
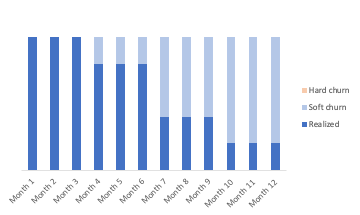
This is a customer who stopped using the product. This is the case of hard churn. Note that we did not attempt to make the distinction between Type A or Type B churn, since we did not have access to that information. The bars in the light orange color represent the revenue that the company would have recognized if the client had not churned. This is part of the calculation we made.
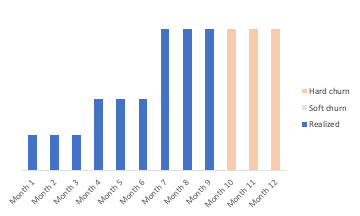
3. The demanding customer
Usage of the product and therefore revenue is unpredictable, going up or down and eventually, the customer hard churns. The light blue bars represent the revenue that was lost because of the soft churn. This is also calculated separately.
4. The disengaged customer
The customer is using the product less and less. He may or may not churn, but he is a textbook example of a Type C soft-churned customer.
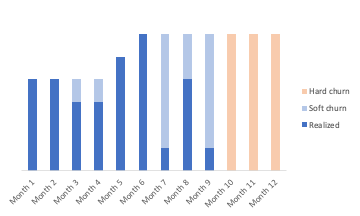
So, with our Blue Dots client, we calculated over the time the total ARR lost from both hard and soft churn and here is what we discovered:
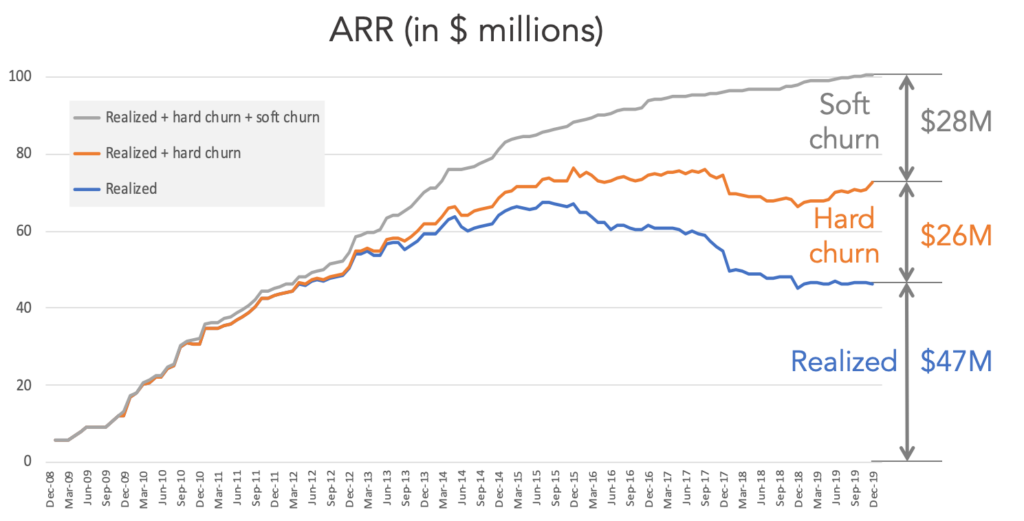
So, at the end of 2019, the ARR was $47 million and the lost revenue coming from hard churn would accumulate to $26 million and the total ARR loss due to soft churn was $28 million. If the company has zero churn, which of course, is almost impossible from a pragmatic standpoint, the business would have reached $101 million in ARR instead of $47 million. Not only that, but the company would have enjoyed a steady growth as opposed to peaking at the end of 2015 and then decreasing its ARR since then.
Assuming a multiple of 8X on the ARR, the value of the business would be over $800 million instead of $376 million, more than a 2X difference. Even by decreasing hard and soft churn by just 15%, the company would have added $65 million in shareholder value.
I would encourage you to run the same analysis for your own business and calculate how much revenue has not been realized because of hard and soft churn and then analyze your churn in both number of accounts and revenue and break it down along the five types of churn. This might be one the most valuable tasks to understand how to grow faster and generate more shareholder value.